
BlackSheep Studios
@blacksheepstudiosofficial
957
Video Count545.2M
Video View3.2M
Subscriber#3,465
India Rank#14,758
Global RankGeneral and Entertainment ranking performance
General
Global
India
Entertainment
Global
India
Total Videos
Content Library
Total Views
Lifetime Views
Subscribers
Community Size
Engagement Rate
Audience Interaction
Top performer by views
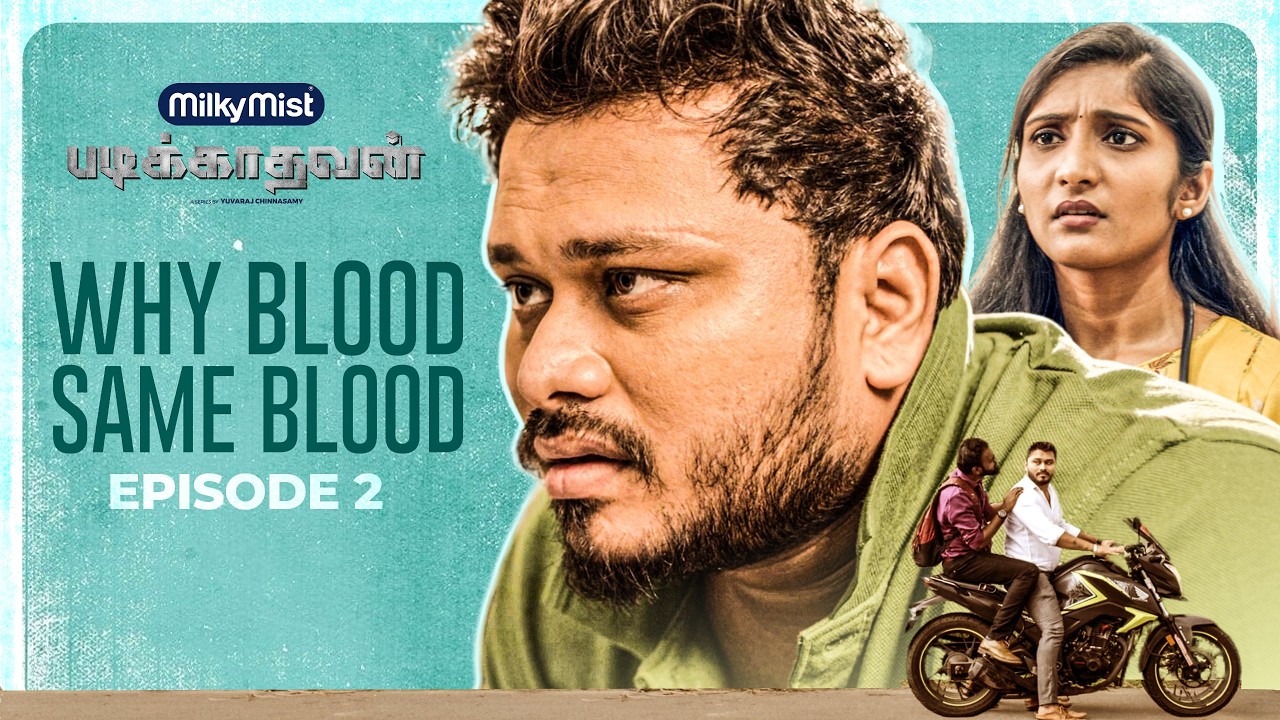
Padikathavan | I Am Back | Episode - 5 | Vj Siddhu | BlackSheep Studios
84.6K
Views
2K
Likes
20
Comments
Opportunity for growth
Customer Waiting 😅 | Episode 3 - Blind Chemistry | Blacksheep Studios
1.6K
Views
18
Likes
0
Comments
Analysis of 16 long-form videos
Padikathavan | I Am Back | Episode - 5 | Vj Siddhu | BlackSheep Studios
• Long videos make up 32% of total content
• Average performance: Better than channel average
• Most common duration: Long (10-30 min)
Upload patterns and optimal timing insights
Content distribution across 3 main categories
Key performance indicators and trends
Entertainment dominates with 45% of content
Television Program has highest avg views
Television Program shows strongest growth
Most used tags across 705 tag instances
14 tags in category
1 tags in category
Comprehensive tag metrics and ROI analysis
| Tag | Usage | Avg Views | Engagement | Growth | ROI Score |
|---|---|---|---|---|---|
| #blacksheep studiosTop 1 | 55 | 8.7K | 3.48% | -25% | 35/100 |
| #tamil web seriesTop 2 | 55 | 8.7K | 3.48% | -25% | 35/100 |
| #blacksheepTop 3 | 50 | 9.1K | 3.42% | -19% | 34/100 |
| #blacksheep studios channel | 50 | 9.1K | 3.42% | -19% | 34/100 |
| #web series | 50 | 9.1K | 3.42% | -19% | 34/100 |
| #series | 50 | 9.1K | 3.42% | -19% | 34/100 |
| #web series tamil | 50 | 9.1K | 3.42% | -19% | 34/100 |
| #trending | 50 | 9.1K | 3.42% | -19% | 34/100 |
| #tamil series | 45 | 9.5K | 3.36% | -9% | 34/100 |
| #kadhaippoma season 2 | 45 | 6.6K | 3.42% | -31% | 34/100 |
| #love in | 45 | 9.5K | 3.36% | -9% | 34/100 |
| #love in short film | 42 | 9.9K | 3.42% | -28% | 34/100 |
| #love series | 42 | 9.9K | 3.42% | -28% | 34/100 |
| #love films | 39 | 9.2K | 2.97% | -22% | 30/100 |
| #kadhaipoma season 2 | 37 | 7K | 3.40% | -37% | 34/100 |
Strategic recommendations and performance highlights
Top 5 by view count


Top 5 by like count

Top 5 by comment count


Top 5 by engagement rate


Peak performance metrics across all categories
Top performers across multiple categories


Performance analysis and recommendations