
Strictly Dumpling
@strictlydumpling
Food967
Video Count1.2B
Video View4.3M
Subscriber#2,556
United States Rank#9,730
Global RankLoading channel statistics
General and Food ranking performance
General
Global
United States
Food
Global
United States
Total Videos
Content Library
Total Views
Lifetime Views
Subscribers
Community Size
Engagement Rate
Audience Interaction
Top performer by views
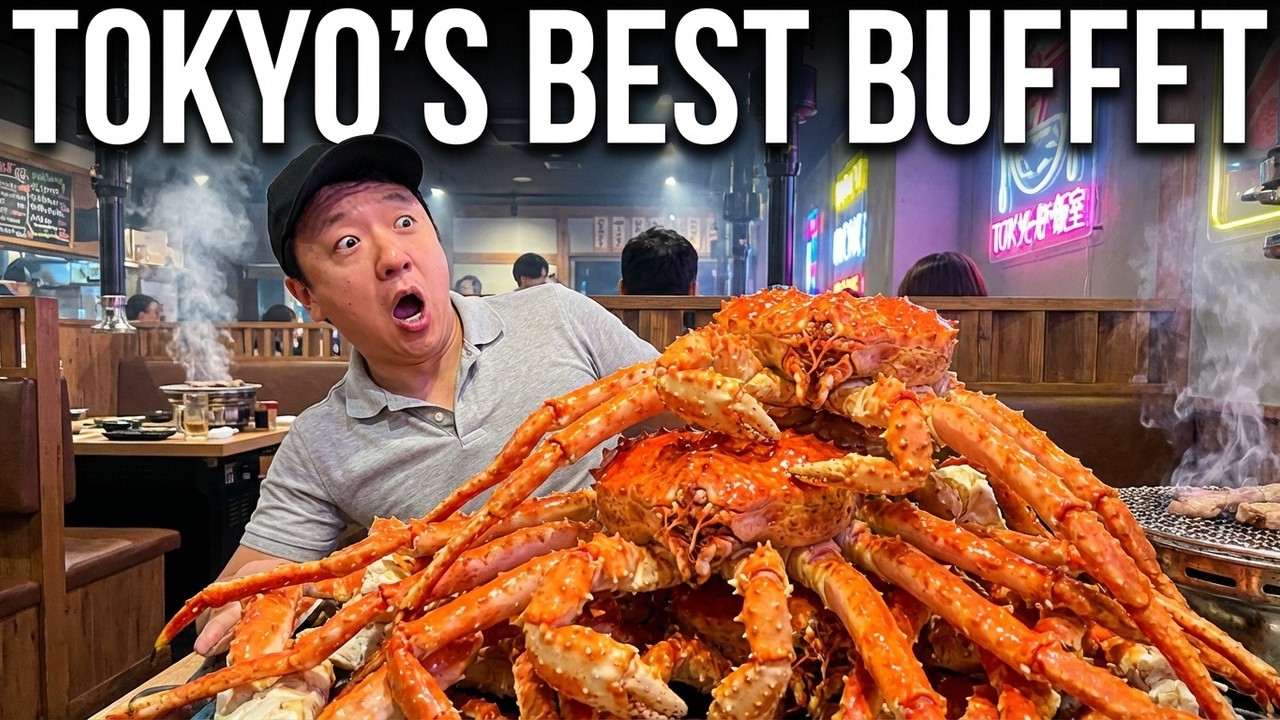
Eating 7-ELEVEN BREAKFAST for an ENTIRE WEEK in Japan!
379.3K
Views
8.9K
Likes
215
Comments
Opportunity for growth
Vietnamese GRILLED LOBSTER from a Street Vendor in Nha Trang, Vietnam!! 🦞🔥
11.1K
Views
289
Likes
23
Comments
Analysis of 47 long-form videos
Eating 7-ELEVEN BREAKFAST for an ENTIRE WEEK in Japan!
• Long videos make up 94% of total content
• Average performance: Better than channel average
• Most common duration: Very Long (30+ min)
Upload patterns and optimal timing insights
Content distribution across 3 main categories
Key performance indicators and trends
Food dominates with 48% of content
Tourism has highest avg views
Food shows strongest growth
Most used tags across 66 tag instances
9 tags in category
6 tags in category
Comprehensive tag metrics and ROI analysis
| Tag | Usage | Avg Views | Engagement | Growth | ROI Score |
|---|---|---|---|---|---|
| #all you can eatTop 1 | 9 | 98K | 3.35% | +111% | 34/100 |
| #street foodTop 2 | 8 | 30.8K | 4.82% | +64% | 49/100 |
| #korean buffetTop 3 | 5 | 103.9K | 3.16% | +100% | 33/100 |
| #food vlog | 5 | 42.8K | 4.61% | -63% | 47/100 |
| #travel food vlog | 5 | 127.4K | 2.60% | -65% | 27/100 |
| #japan food vlog | 4 | 200K | 2.85% | +0% | 30/100 |
| #tokyo food vlog | 4 | 211.2K | 2.72% | +0% | 29/100 |
| #all you can eat buffet | 4 | 59.4K | 4.11% | +0% | 42/100 |
| #buffet | 4 | 47K | 4.52% | +0% | 46/100 |
| #korean food vlog | 3 | 119.3K | 2.88% | +100% | 30/100 |
| #seafood buffet korea | 3 | 62.5K | 4.06% | +100% | 41/100 |
| #best buffet in seoul | 3 | 62.5K | 4.06% | +100% | 41/100 |
| #asian street food | 3 | 117.9K | 2.42% | -69% | 25/100 |
| #seoul food vlog | 3 | 111.1K | 3.42% | -53% | 35/100 |
| #korean food | 3 | 150.7K | 2.82% | -18% | 30/100 |
Strategic recommendations and performance highlights
Top 5 by view count


Top 5 by like count


Top 5 by comment count


Top 5 by engagement rate


Peak performance metrics across all categories
Top performers across multiple categories


Performance analysis and recommendations